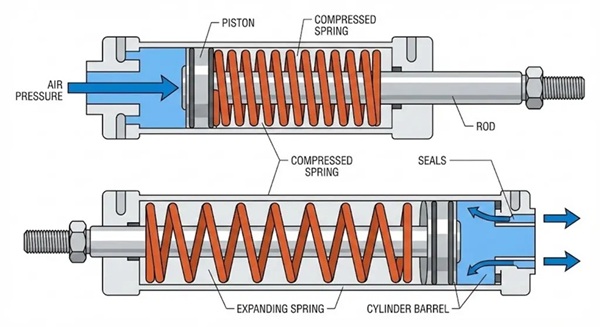
Check/Verify the spring force inside the valve actuator
To check the spring power (force) in a pneumatic actuator, measure the air pressure required to initiate spring movement and compare it against the manufacturer’s specification. Key steps include using a regulator to slowly apply pressure while monitoring for the exact moment the valve moves, ensuring the spring fully returns the valve to its fail-safe position.
This video shows how to test for leaks in a pneumatic actuator, which is a key part of assessing the actuator's overall health:
Methods for Checking Spring Strength
Pressure Range Test: Apply regulated air to the actuator and determine the exact pressure at which the spring begins to compress (start of range) and when it reaches full stroke (end of range). Compare this to the actuator's nameplate data.
Failed Position Check: Disconnect the air supply entirely. The spring must be powerful enough to force the actuator to its default position (fail-closed or fail-open) without sticking, indicating it is not broken or weakened.
Physical Inspection (Disassembly): If the valve behaves sluggishly or fails to hold position, dismantle the actuator (following manufacturer instructions) to inspect for broken, fatigued, or corroded springs.
Troubleshooting Tips
Slow Action/Binding: If the valve moves slowly, the spring may be weak, or internal friction may be too high.
No Movement: If no movement occurs, the spring may be broken, or the piston/diaphragm may be seized.
Leak Testing: Use soapy water on the actuator vent to check for air leaks that might be mistaken for a weak spring.
To check the "power" or force of a spring inside a pneumatic actuator, you can use observational diagnostics, manual pressure testing, or direct measurement if the unit is disassembled.
Note: Springs in these actuators are under high tension and can cause severe injury; never disassemble a spring cartridge without manufacturer-approved tools.
1. Functional Performance Test (Non-Invasive)
The simplest way to check spring health is to observe the actuator's fail-safe behavior.
Observe Stroke Movement: Remove the air supply and watch the valve return to its "fail" position. The movement should be smooth without hesitation, grinding, or sticking.
Measure Stroke Time: Compare the time it takes for the spring to close/open the valve against the original baseline values. A significant slowdown often indicates a weakened or broken spring.
Verify Position: Ensure the valve reaches its full fail-safe stop. If it doesn't reset properly, the spring may be failing.
2. Bench Pressure Test
You can determine the spring's "operating range" by using a controlled air supply and a pressure gauge.
Determine Start-to-Close/Open Pressure: Slowly increase or decrease air pressure and note the exact PSI/bar where the valve begins to move against the spring.
Check Against Specifications: Compare these pressure readings to the manufacturer's data sheet. If the air pressure required to move the spring is lower than specified, the spring has lost tension.
3. Direct Spring Force Measurement (Disassembled)
If the actuator is disassembled and the spring is safely removed:
Check Squareness: Place the spring on a flat surface and use a try square to check for deviations. If it is tilted more than 1.5 mm, it should be replaced.
Measure Force at Height: Use a specialized spring tester or a press with a load cell. Measure the pressure (in pounds or Newtons) at the "valve closed" height and "valve open" height specified by the manufacturer.
Calculate Theoretical Force: If you know the spring rate (x ) and the displacement (F = K · x ), you can use Hooke’s Law:
Key Aspects of Pneumatic Actuator Testing and Validation
Force and Pressure Calibration: Actuator performance is validated by matching input pressure with output force. For example, a cylinder with an area (A) operating at a pressure (P) should yield a force (F) of F = P x A. Experimental tests often reveal a small deviation (e.g., less than 1%) in pressure-stroke relationships when comparing results to theoretical models.
Leakage and Friction Monitoring: During tests, pressure holding checks ensure the actuator can maintain its position. Discrepancies between theoretical calculations and practical tests are often due to friction and internal leakage, which can be quantified in test benches.
Dynamic Response and Speed: Time-based testing measures the activation and deactivation times of the actuator at various pressures. Research shows that while experimental results may vary slightly from numerical models, they generally show linear increases in time with lower pressure values.
Proportional Control and Position: When using proportional valves for positioning, tests are conducted to match the displacement with the control signal. Experiments for high-performance positioning show that pneumatic systems can achieve high accuracy (similar to electric actuators) when using feedback loops to correct for air compressibility.
1. Zero and Range Adjustment
Before complex testing, the actuator's mechanical range must be aligned. This involves setting the "zero point" (0% stroke) and "full range" (100% stroke). For a standard 0.02 to 0.10 MPa control signal, the midpoint (50%) should correspond to 0.06 MPa, where the connecting rod should ideally be perpendicular to the horizontal plane. .
2. Full Stroke Deviation Test
To match theoretical stroke positions, a series of input signals are applied (20%, 40%, 60%, 80%, and 100%).
Theoretical Expectation: The piston should move linearly with the pressure increase.
Acceptable Matching: The deviation at each point should be ≤ 1.5% of the full stroke.
3. Non-Linear Deviation Testing
This test compares the actual pressure-stroke relationship against a linear theoretical model.
Method: Gradually increase pressure from 0% to 100%, then decrease it back to 0%, recording the stroke at specific intervals (e.g., every 0.008 MPa).
Acceptable Matching: The non-linear deviation between actual and theoretical values should be ≤ 1%
4. Dynamic Performance Validation
Theoretical models often assume ideal conditions, but real-world tests must account for variables like friction and thermal exchange.
Torque and Work: In experimental evaluations, mechanical work performed is often found to be within 3.2% to 14.4% of theoretical values.
Response Time: Activation and deactivation times are measured and compared against theoretical flow coefficients (Cv or Kv) found in manufacturer datasheets.
Positioning Accuracy: Theoretical accuracy often decreases as stroke speed and load increase, which can be verified using a test bench with proportional valves.
Safety Checklist
Isolate Energy: Shut off the pneumatic supply and vent all residual air pressure before inspection.
Lockout/Tagout: Secure supply valves to prevent accidental re-pressurization during testing.
Use PPE: Wear safety glasses and gloves to protect against flying debris or sharp edges.
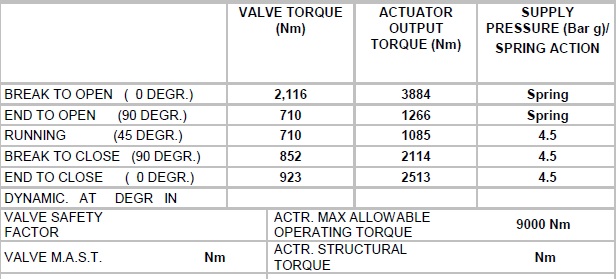
To check the spring force of an actuator after years of operation, you must first have the datasheet available to verify potential performance degradation. The figure below shows the datasheet specifications.
Test Setup
Actuator Remove from the Valve
Supply pressure directly connected to the pneumatic cylinder of actuator
Supply pressure was increased slowly so as identify and record the pressure value at which the actuator begins stroking and afterwards at which pressure value it reaches the end of its stroke (see below actuator test result)
Actuator installed back on the valve
The pressure values were sent to BIFFI technical office which made comparision with theoretical values
The test
Fail Action Actuator - Actuator Algas 1.5C -1100 - 485-OP
Angular position
Valve Torque (Nm)
Supply Pressure (bar)
BREAK at 0°
0
2,55
END at 90°
0
1,47
Conclusion
To match a pneumatic actuator test with theoretical values, you must calculate the theoretical force (F = P x A) and stroke positions, then measure the actual output using calibrated gauges and transducers. A successful match is generally defined by a full stroke deviation of ≤ 1.5% and a non-linear deviation of ≤ 1% relative to the theoretical linear model.
To understand the theoretical force of an actuator, simply find the diameter of the cylinder (cylinder bore) where the air or hydraulic oil pressure pushes.
For further clarification, please don't hesitate to contact our expert
.
Have a Questions?
+(39) 347 051 5328
Visit Our Company
Italy - Kazakhstan
Working Hours
09.00am to 18.00pm
About
We offer the best and economical solutions, backed by 27+ years of experience and international standards knowledge, echnological changes, and industrial systems.